7 Effective Report Writing Techniques to Master in 2025
In today's data-driven professional landscape, the ability to communicate complex information clearly and persuasively is a critical skill. Many professionals, however, find report writing to be a time-consuming and challenging task. A poorly structured report can obscure key insights, lead to flawed decisions, and waste valuable time. The difference between a report that gets read and one that gets ignored often lies in the framework used to structure and present its content. This is especially true when dealing with specialized information; to make your reports compelling, focus on translating complex concepts into clear language, just as you would learn to translate legal jargon like a pro.
This guide moves beyond generic advice to provide a deep dive into seven powerful and effective report writing techniques used by top consultants, scientists, and business leaders. We will explore proven methods like the Pyramid Principle and the IMRAD structure, providing actionable steps and real-world examples for each. Additionally, we will show you how leveraging a tool like Whisperit can streamline the entire process, from dictating initial thoughts to polishing the final draft. By mastering these techniques, you can produce high-impact reports more efficiently, ensuring your analysis is understood and acted upon.
1. The Pyramid Principle
One of the most powerful and effective report writing techniques is the Pyramid Principle, a top-down communication method developed by former McKinsey consultant Barbara Minto. This structured approach inverts the traditional way of presenting information. Instead of building up to a conclusion, you state your main conclusion or recommendation upfront, then support it with increasingly granular detail.
This "answer-first" structure is ideal for busy executives and professionals in fields like law and healthcare, who need to grasp the core message immediately. It ensures your report is logical, clear, and persuasive, preventing your key insights from getting lost in the details. By leading with the "so what," you respect your reader's time and focus their attention on the most critical information from the outset.
How the Pyramid Principle Works
The principle organizes ideas into a hierarchical structure, ensuring that every point you make directly supports the one above it. This creates a clear, logical argument that is easy for the reader to follow. The structure consists of three primary levels.
The infographic below illustrates this hierarchical relationship, showing how a single, powerful conclusion is supported by key arguments and detailed evidence.
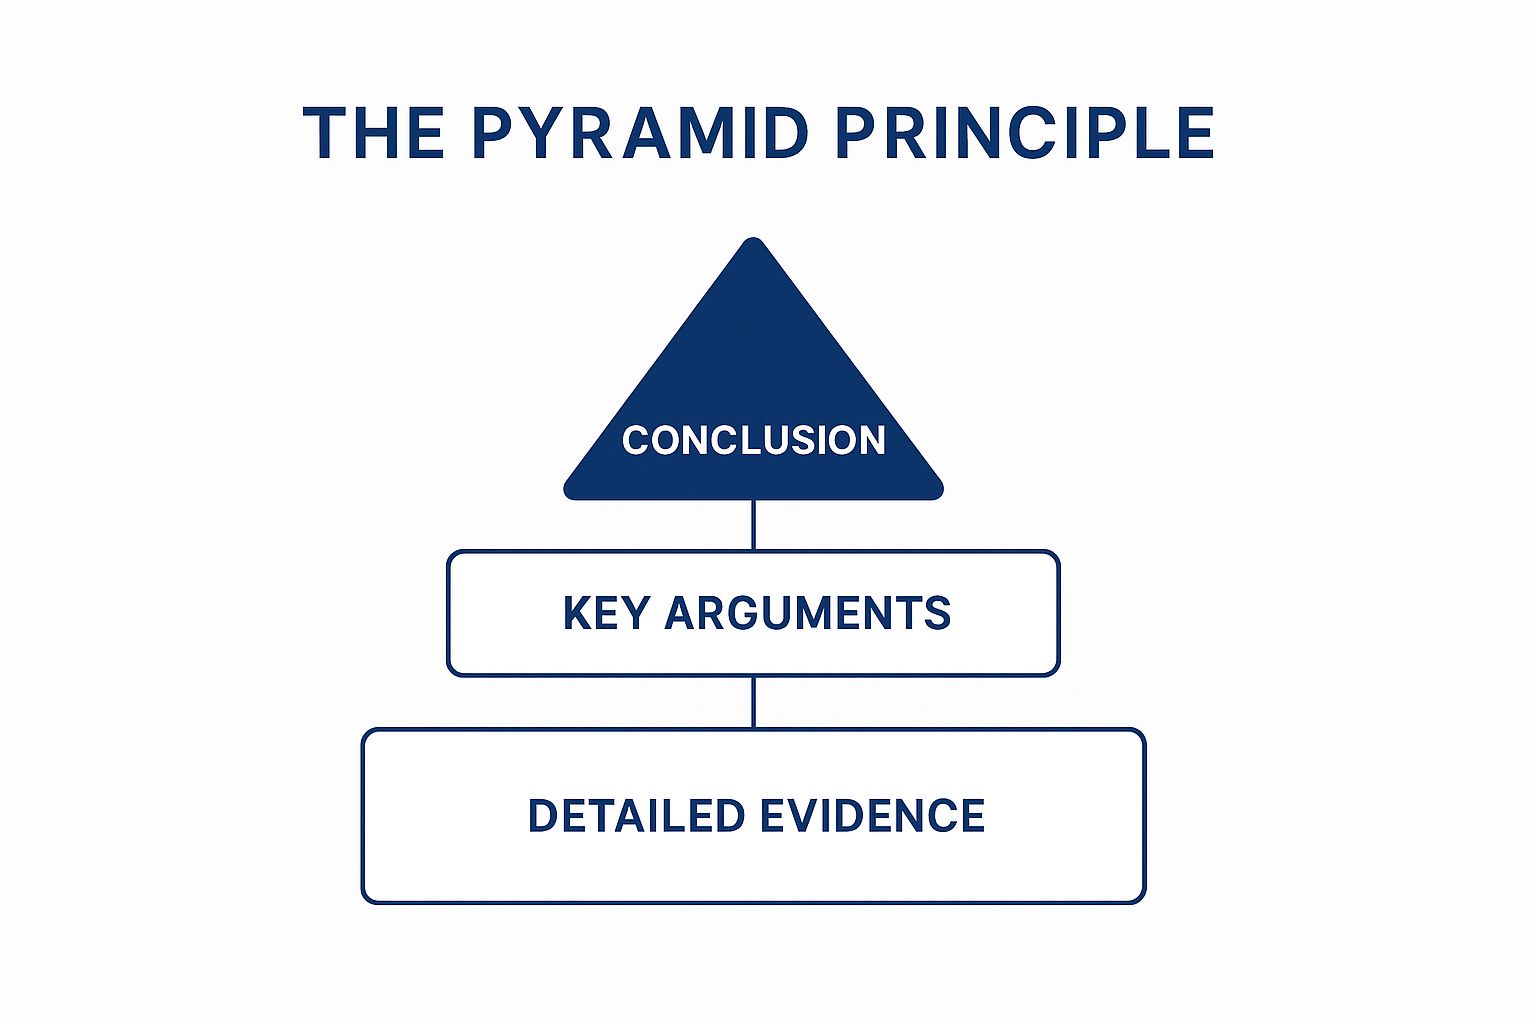
This visual hierarchy demonstrates that the main conclusion is the most prominent element, with each subsequent level providing the necessary foundation to validate the tier above it.
Actionable Tips for Implementation
To effectively apply the Pyramid Principle, follow these actionable steps:
- Start with the SCQA Framework: Before writing, map out your core argument using Situation (the context), Complication (the problem or change), Question (the implicit question raised), and Answer (your main conclusion). Your "Answer" becomes the apex of your pyramid.
- Group and Summarize: Logically group your supporting ideas. For example, all points related to financial impact should be under one key argument. Each group of ideas at a lower level must collectively summarize the point on the level above it.
- Test Your Logic: Read only your top-level points (the conclusion and key arguments). If the narrative makes sense on its own, your structure is sound. This ensures your high-level summary is robust and coherent.
Whisperit Pro-Tip: Dictate your core conclusion and supporting arguments into Whisperit first. Use the AI editing features to refine these high-level points into clear, single sentences before you start drafting the detailed evidence. This helps you build a strong pyramid structure from the beginning.
2. IMRAD Structure
A cornerstone of scientific and technical writing, the IMRAD structure is an effective report writing technique that organizes information into four clear sections: Introduction, Methods, Results, and Discussion. This standardized format creates a logical narrative, guiding the reader from the initial research question and context through the experimental process, to the objective findings, and finally to their interpretation and significance.
This highly organized approach is essential in fields where clarity, transparency, and reproducibility are paramount, such as clinical research, engineering, and environmental science. By separating what was done (Methods) from what was found (Results) and what it means (Discussion), IMRAD prevents ambiguity and allows readers to critically evaluate the study's validity. It ensures your report is not just a collection of data but a coherent story of scientific inquiry.
How the IMRAD Structure Works
The IMRAD format provides a logical flow that mirrors the scientific method itself. Each section answers a specific question, creating a structured path for the reader. This methodical progression makes complex technical information accessible and allows peers to easily locate specific details, from the experimental setup to the final conclusions.
- Introduction: Why was this study conducted? It sets the context, states the research problem, and outlines the objectives.
- Methods: How was the study conducted? It details the procedures, materials, and techniques used, providing enough information for the work to be replicated.
- Results: What were the findings? This section presents the objective data collected, often using tables and figures, without interpretation or commentary.
- Discussion: What do the results mean? Here, you interpret the findings, compare them to previous research, discuss implications, and acknowledge limitations.
Actionable Tips for Implementation
To effectively implement the IMRAD structure in your technical or scientific reports, follow these actionable steps:
- Write the Methods Section First: Many experienced writers draft the Methods section first while the procedures are still fresh. This section is often the most straightforward to write and provides a solid foundation for the rest of the report.
- Present Results Objectively: In the Results section, stick to the facts. Present your data clearly using visuals like charts and graphs, but save all interpretation and explanation for the Discussion section. This maintains the integrity of your findings.
- Connect Discussion to Introduction: Your Discussion should directly address the research question or hypothesis stated in your Introduction. Explicitly state whether your results support your initial hypothesis and explain how they contribute to the broader field of study.
Whisperit Pro-Tip: The Methods section requires precise detail. Dictate your procedures step-by-step into Whisperit as you perform them or immediately after. This captures granular details you might otherwise forget and ensures your methodology is accurate and reproducible. You can then use AI editing to format the transcript into a clear, concise narrative.
3. Executive Summary First Approach
Another of the most effective report writing techniques is the Executive Summary First Approach. This method prioritizes the needs of busy decision-makers by placing a comprehensive, standalone summary at the very beginning of the document. Unlike a simple introduction, the executive summary functions as a mini-report, encapsulating all key findings, analyses, conclusions, and recommendations.
This front-loaded structure is invaluable for senior leaders in sectors like management consulting and government, who must absorb critical information quickly. Its purpose is to provide a complete picture, allowing a reader to understand the entire scope and impact of the report without needing to read the full text. This ensures your core message is delivered efficiently, even if the reader goes no further.
How the Executive Summary First Approach Works
This technique requires crafting a summary that tells a complete and compelling story on its own. It serves as both a high-level overview and a condensed version of the full report, structured to communicate the most crucial information immediately. This is commonly seen in World Bank development reports, Deloitte industry analyses, and government policy white papers.
The summary should be written with precision and clarity, hitting every major point from the main body of the report. For mastering conciseness and impact, delve into the principles of how to write good summaries, a cornerstone of effective Executive Summaries. It should enable an executive to confidently make a decision based on its contents alone. You can learn more about professional report structure to ensure all components align.
Actionable Tips for Implementation
To implement the Executive Summary First Approach successfully, follow these actionable steps:
- Write the Summary Last: Although it appears first, draft the executive summary after the entire report is complete. This ensures you can accurately and comprehensively distill the final findings and recommendations.
- Include Specifics, Not Generalities: Your summary should be concrete. Use specific data, figures, and key performance indicators. Instead of saying "significant improvement," state "a 15% increase in Q3 revenue."
- Structure for Scannability: Use bullet points, bold text, and clear subheadings to break up the content. This makes it easy for a reader to quickly identify the most important takeaways, such as "Key Findings," "Analysis," and "Recommended Actions."
Whisperit Pro-Tip: Once your full report is written, dictate a draft of your executive summary into Whisperit. Focus on narrating the report's story from start to finish. Then, use the AI editing tools to condense and sharpen each point, ensuring it’s a powerful, self-contained narrative.
4. Data Storytelling with Visual Integration
One of the most effective report writing techniques for modern professionals is data storytelling. This method combines rigorous quantitative analysis with a compelling narrative structure and integrated visualizations. Instead of just presenting numbers and charts, this approach transforms data points into a cohesive story, making complex information more accessible, memorable, and persuasive for your audience.
Data storytelling is invaluable in fields like healthcare and compliance, where large datasets must be translated into clear, actionable insights. By framing data within a narrative, you guide the reader through your findings, explaining the context, highlighting key trends, and leading them to a logical conclusion. This ensures your report not only informs but also engages and persuades.
This technique moves beyond simple data presentation to create a powerful argument. For example, a compliance report could use a story arc to show how a new security protocol (the plot) successfully reduced incident rates (the climax), supported by charts showing the decline over time.
How Data Storytelling Works
Popularized by experts like Cole Nussbaumer Knaflic and Hans Rosling, data storytelling treats data as the evidence within a plot. The context provides the setting and conflict, the key insights drive the narrative forward, and the visualizations serve as the crucial proof. This structure transforms a dry report into an engaging journey of discovery.
The goal is to answer the "so what" question for every piece of data you present. Each chart or graph should have a purpose that directly supports the central message of your report. Strong visual integration is central to this, as well-crafted visuals can communicate patterns and outliers far more effectively than text alone. For further insights on presenting complex information, explore our guide on documentation best practices.
Actionable Tips for Implementation
To implement data storytelling in your reports, follow these key steps:
- Define Your Core Message: Before you choose your data, decide on the single most important insight you want your audience to take away. Every element of your story, from the text to the charts, should reinforce this message.
- Choose the Right Visuals: Select chart types that best tell your story. A line chart is great for showing trends over time, a bar chart works well for comparisons, and a heat map can reveal concentrations. Avoid clutter and ensure your visuals are clean and easy to read.
- Use Annotations and Color Strategically: Guide your reader's eye by using annotations to point out specific data points. Employ color consistently and purposefully, using a distinct color to highlight the most important information and neutral colors for context.
Whisperit Pro-Tip: Dictate your narrative first. Talk through the story you want the data to tell, from the initial problem to the final conclusion. Use Whisperit to capture this flow, then insert your charts and graphs. This ensures your visualizations support a clear, pre-defined narrative.
5. Problem-Solution-Benefits Framework
A powerful technique for persuasive writing, the Problem-Solution-Benefits Framework guides your reader through a logical sequence designed to build consensus and drive action. This approach first establishes a clear, well-defined problem, then presents a compelling solution, and finally highlights the tangible benefits of adopting that solution. It’s one of the most effective report writing techniques for proposals and recommendation reports.
This framework is highly effective in contexts where securing stakeholder buy-in is the primary goal. It systematically addresses the "what's in it for me?" question from the reader's perspective, making it a staple in management consulting, IT proposals, and organizational change initiatives. By framing your recommendations this way, you move beyond simply presenting data and instead craft a persuasive narrative for change.
How the Problem-Solution-Benefits Framework Works
This framework creates a clear, structured argument that connects a pressing issue directly to a valuable outcome. It moves the reader from understanding the current pain points to envisioning a better future state, making your proposed solution feel necessary and logical. The structure is built on three sequential components.
First, you diagnose and quantify the Problem, using data to illustrate its impact. Next, you present one or more specific Solutions, detailing how they address the root causes of the problem. Finally, you articulate the Benefits, translating the solution's features into concrete, positive outcomes for the organization.
This logical flow ensures your report is not just informative but also highly influential, guiding stakeholders toward a desired decision.
Actionable Tips for Implementation
To effectively apply the Problem-Solution-Benefits Framework, follow these actionable steps:
- Quantify the Problem: Don't just state the problem; prove its significance. Use specific metrics, costs, and data points to demonstrate its negative impact on operations, finances, or compliance.
- Present Solution Alternatives: Where appropriate, offer more than one solution. Briefly outline the pros and cons of each alternative to show you have conducted a thorough analysis before arriving at your final recommendation.
- Focus on 'Benefits,' Not 'Features': A feature is what your solution is (e.g., "new compliance software"). A benefit is what your solution does for the reader (e.g., "reduces reporting time by 40% and lowers non-compliance risk"). This distinction is critical for persuasion.
- Address Objections Proactively: Anticipate potential concerns or counterarguments and address them directly within your report. This demonstrates foresight and builds credibility with your audience. For guidance on structuring reports in regulated fields, see how you can apply this to a compliance report template.
Whisperit Pro-Tip: Use Whisperit to brainstorm each section separately. First, dictate all the details about the problem. Next, record your thoughts on potential solutions. Finally, dictate the specific benefits. Use the AI to organize these distinct recordings into a cohesive and persuasive report structure.
6. Chronological Narrative Structure
Another of the most effective report writing techniques is the Chronological Narrative Structure, which organizes information based on a time sequence. This method presents events, developments, or processes as they occurred, guiding the reader through a logical progression from beginning to end. It's an intuitive framework that makes complex sequences easy to follow.
This structure is invaluable for reports where the "how" and "when" are just as important as the "what." It is particularly effective for project management updates, incident reports, and historical case studies, as it clearly illustrates cause-and-effect relationships. By laying out events sequentially, you provide a transparent and comprehensive account that builds understanding step-by-step, ensuring critical context isn't missed.
How the Chronological Narrative Structure Works
This technique arranges your report's content along a timeline. The narrative starts at a specific point in the past and moves forward, detailing key stages, milestones, and decisions in the order they happened. This creates a coherent story that is easy for any reader to process, regardless of their prior knowledge of the subject.
This approach is essential for a variety of professional documents. For instance, it's used in NASA’s Apollo program documentation to track mission progress, in clinical trial reports to detail patient progression, and in corporate post-mortems to analyze the events leading up to a crisis. The goal is to create a clear, linear path that explains the journey from the starting point to the final outcome.
Actionable Tips for Implementation
To apply the Chronological Narrative Structure effectively, follow these actionable steps:
- Establish Clear Time Markers: Use explicit dates, times, or phase labels (e.g., "Phase 1: Planning," "Q2 2023") to anchor your reader in the timeline. This prevents confusion and reinforces the sequential flow of your report.
- Highlight Key Milestones: Emphasize critical turning points, major decisions, or significant achievements. This breaks up the narrative and draws attention to the moments that had the most impact on the final outcome.
- Balance Detail with Pacing: While chronology is key, avoid a monotonous recitation of every minor event. Focus on the information that is most relevant to the report's purpose and use summaries to bridge less critical periods, maintaining reader engagement. Mastering this balance is central to strong documentation workflow management.
Whisperit Pro-Tip: Use Whisperit to dictate the entire sequence of events for your project or case study in a single recording session. After transcribing, use the AI features to automatically create summaries for each major phase. This helps you structure your chronological report with clear, concise transition points.
7. Comparative Analysis Matrix
When your report needs to evaluate multiple options against a common set of standards, the Comparative Analysis Matrix is one of the most effective report writing techniques at your disposal. This structured approach uses tables or grids to present a side-by-side comparison, making it incredibly easy for readers to assess trade-offs and make a well-informed decision.
This technique is invaluable in fields like enterprise technology, finance, and strategic planning, where choices between vendors, investments, or strategies have significant consequences. By organizing complex data into a clear, visual format, you eliminate ambiguity and guide your audience toward a logical conclusion based on transparent criteria. It transforms dense information into a straightforward decision-making tool.
This visual framework simplifies complex comparisons, such as in a vendor selection report or a technology platform evaluation, allowing stakeholders to quickly identify the strengths and weaknesses of each alternative.
How a Comparative Analysis Matrix Works
The matrix organizes information with options (e.g., vendors, software, strategies) listed as columns and evaluation criteria (e.g., cost, features, compliance) as rows. Each cell in the grid contains an assessment, which can be a quantitative score, a qualitative rating (like "High," "Medium," "Low"), or a concise comment. This systematic layout ensures that every option is judged by the same standards.
The structure is especially powerful when criteria are weighted based on importance, providing a final score that reflects organizational priorities. For a deeper understanding of structured evaluation frameworks, you can explore how a risk assessment matrix works on whisperit.ai.
Actionable Tips for Implementation
To build a robust Comparative Analysis Matrix, follow these precise steps:
- Define Clear Criteria: Collaborate with stakeholders to establish specific, measurable, and relevant evaluation criteria before you begin. For instance, instead of "good support," use "24/7 phone support availability" and "average ticket resolution time."
- Use Consistent Scales: Apply a uniform scoring system for all options to ensure a fair comparison. Whether using a 1-5 scale, a percentage, or a traffic light system (red, yellow, green), consistency is key.
- Balance Quantitative and Qualitative: Include both hard numbers (like pricing) and qualitative assessments (like ease of use or vendor reputation). This provides a more holistic view for decision-makers.
Whisperit Pro-Tip: Dictate your evaluation criteria and initial assessments for each option into Whisperit. Use the "Summarize" feature to condense lengthy notes into concise bullet points for each cell in your matrix. This saves significant time and ensures your final report is clear and to the point.
Effective Report Writing Techniques Comparison
| Report Structure | Implementation Complexity 🔄 | Resource Requirements ⚡ | Expected Outcomes 📊 | Ideal Use Cases 💡 | Key Advantages ⭐ |
|---|---|---|---|---|---|
| The Pyramid Principle | Moderate 🔄🔄 | Moderate ⚡ | Clear, logical flow; faster decision-making 📊📊 | Strategic reports, executive summaries, consulting | Enables quick understanding; reduces cognitive load; improves clarity ⭐⭐ |
| IMRAD Structure | Moderate 🔄🔄 | Moderate ⚡ | Rigorous scientific communication 📊⭐ | Scientific research, academic papers, clinical studies | Universally recognized; reproducible; supports peer review ⭐⭐ |
| Executive Summary First Approach | Low to Moderate 🔄 | Low to Moderate ⚡ | Quick access to key messages 📊 | Business reports, policy, board presentations | Accommodates busy executives; increases message read rate ⭐ |
| Data Storytelling w/ Visuals | High 🔄🔄🔄 | High ⚡⚡ | Engaging, memorable reports with insights 📊⭐⭐ | Data analysis, market research, dashboards, presentations | Enhances comprehension; appeals to diverse learners; reduces misinterpretation ⭐ |
| Problem-Solution-Benefits | Moderate 🔄🔄 | Moderate ⚡ | Persuasive, action-driven recommendations 📊 | Business proposals, change management, strategic planning | Creates compelling case; facilitates alternatives comparison ⭐ |
| Chronological Narrative Structure | Low 🔄 | Low ⚡ | Easy-to-follow event sequences 📊 | Project reports, case studies, incident analyses | Natural flow; highlights cause-effect; appeals to storytelling preference ⭐ |
| Comparative Analysis Matrix | Moderate to High 🔄🔄🔄 | Moderate to High ⚡⚡ | Objective, transparent decision-making 📊⭐ | Vendor evaluation, investment decisions, policy comparisons | Clarifies trade-offs; reduces bias; enables scenario planning ⭐ |
Putting It All Together: Your Blueprint for Impactful Reporting
We've explored a powerful arsenal of effective report writing techniques, moving far beyond a one-size-fits-all approach to documentation. From the top-down clarity of the Pyramid Principle to the rigorous scientific narrative of IMRAD, each framework serves a distinct purpose. Mastering these structures is not about memorizing rules; it's about developing the strategic foresight to choose the right tool for the job.
The true value of these methods lies in their ability to transform information into influence. When you consciously structure your findings, you guide your reader's thinking, making your conclusions feel both logical and inevitable. A well-crafted executive summary can secure buy-in before the reader even reaches the details, while a compelling data story can make complex metrics accessible and memorable for even the most non-technical stakeholders. This is the core of impactful reporting: ensuring your hard-earned insights resonate and drive action.
From Technique to Transformation
The ultimate goal is to make these frameworks second nature. Consider the reports you create most often. A legal professional might find the Chronological Narrative Structure essential for case summaries, while a healthcare provider relies on the IMRAD format for clinical research. A security officer presenting a vulnerability assessment could use the Problem-Solution-Benefits Framework to justify resource allocation for new security measures.
To internalize these approaches, try this actionable exercise:
- Identify: Select a recent report you've written.
- Analyze: Which of the seven techniques discussed would have been the most effective structure for that report's objective and audience?
- Re-outline: Briefly sketch a new outline for that report using the chosen framework.
This simple practice will sharpen your strategic thinking, helping you instinctively select the optimal structure for future projects. This deliberate practice is the bridge between knowing about effective report writing techniques and consistently executing them.
Streamlining Your Workflow with Modern Tools
Adopting these sophisticated structures doesn't mean you have to spend more time on documentation. In fact, by integrating modern tools, you can significantly accelerate the process. Imagine dictating patient notes or client meeting summaries directly into a structured template using Whisperit's AI. This allows you to capture raw data and complex thoughts with speed and precision, letting the technology handle the transcription while you focus on analysis and synthesis. For those with recurring reporting needs, such as weekly compliance updates or project status reports, exploring methods for how to automate content creation for weekly reports can further enhance efficiency and consistency across your documentation.
By marrying proven structural methodologies with powerful AI dictation and editing tools, you create a workflow that is both highly effective and remarkably efficient. This synergy frees you from the drudgery of manual typing and allows you to dedicate your valuable time to the high-level strategic thinking that truly shapes outcomes. You're no longer just a reporter of facts; you become an architect of understanding, crafting documents that inform, persuade, and inspire decisive action.
Ready to cut your documentation time in half and focus on what truly matters? Discover how Whisperit can revolutionize your report writing process with best-in-class AI dictation and transcription. Transform your spoken ideas into polished, structured text and elevate your efficiency today.